
Cities around the world are sinking at ‘worrying speed’
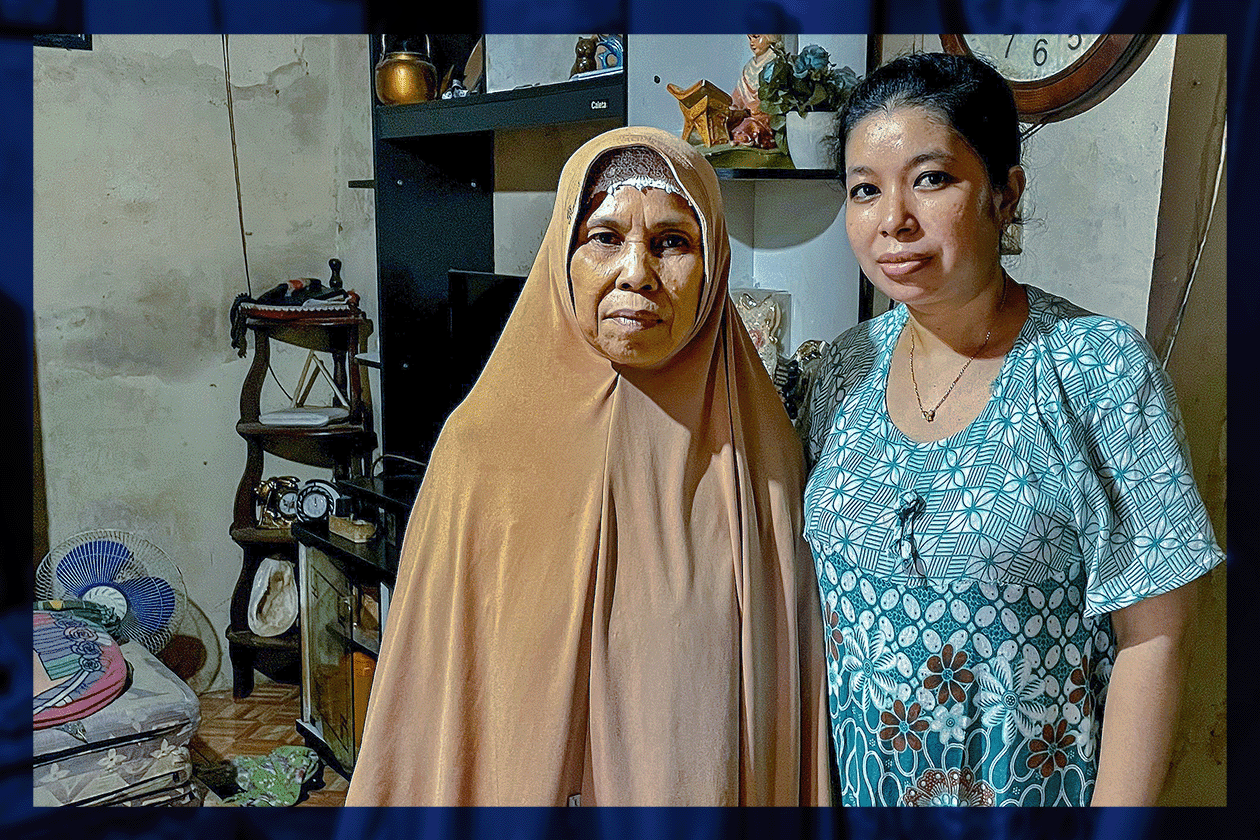
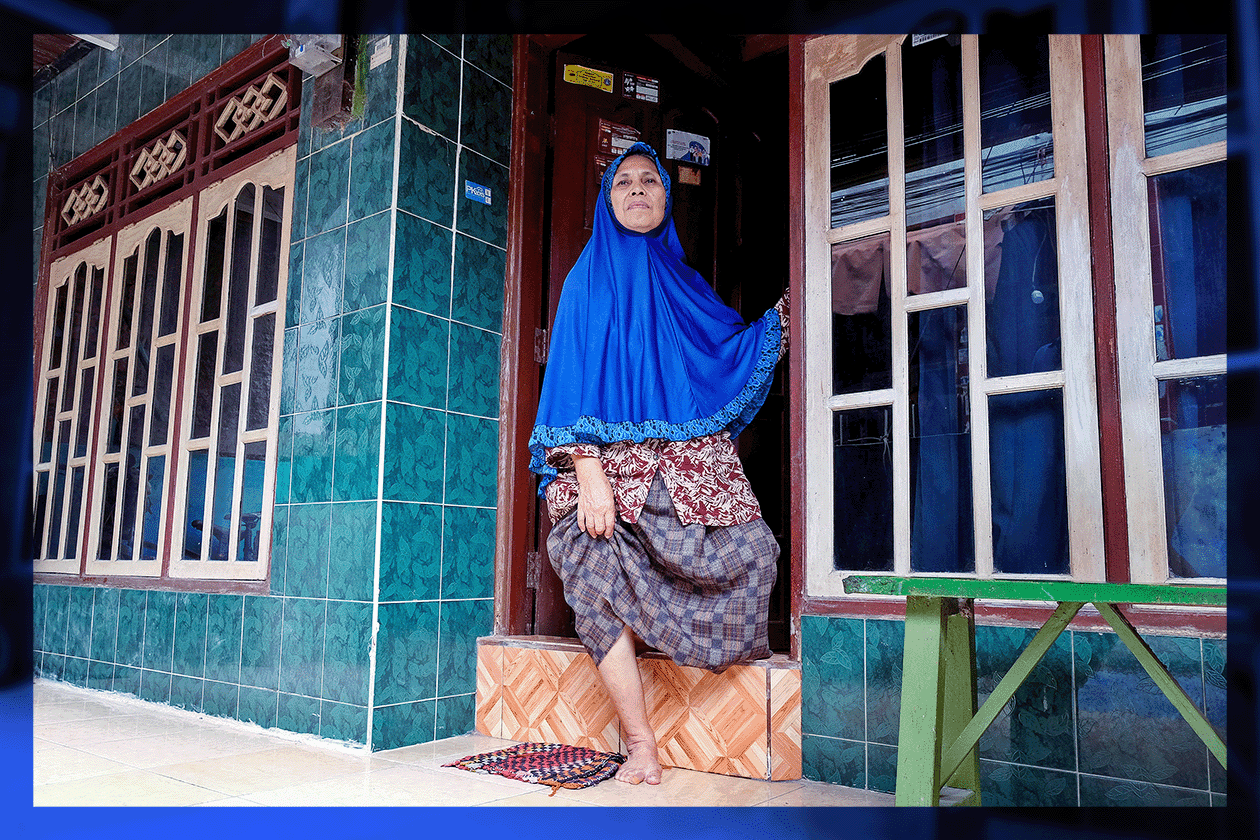
Twenty-two years ago, when Erna stood outside her house, “the windows were as high as my chest”. Now they’re knee-height.
As their home has sunk, she and her family have had to cope with frequent flooding. In the most extreme cases “we used canoes - the water kept coming in and swamped the ground floor”, she says.
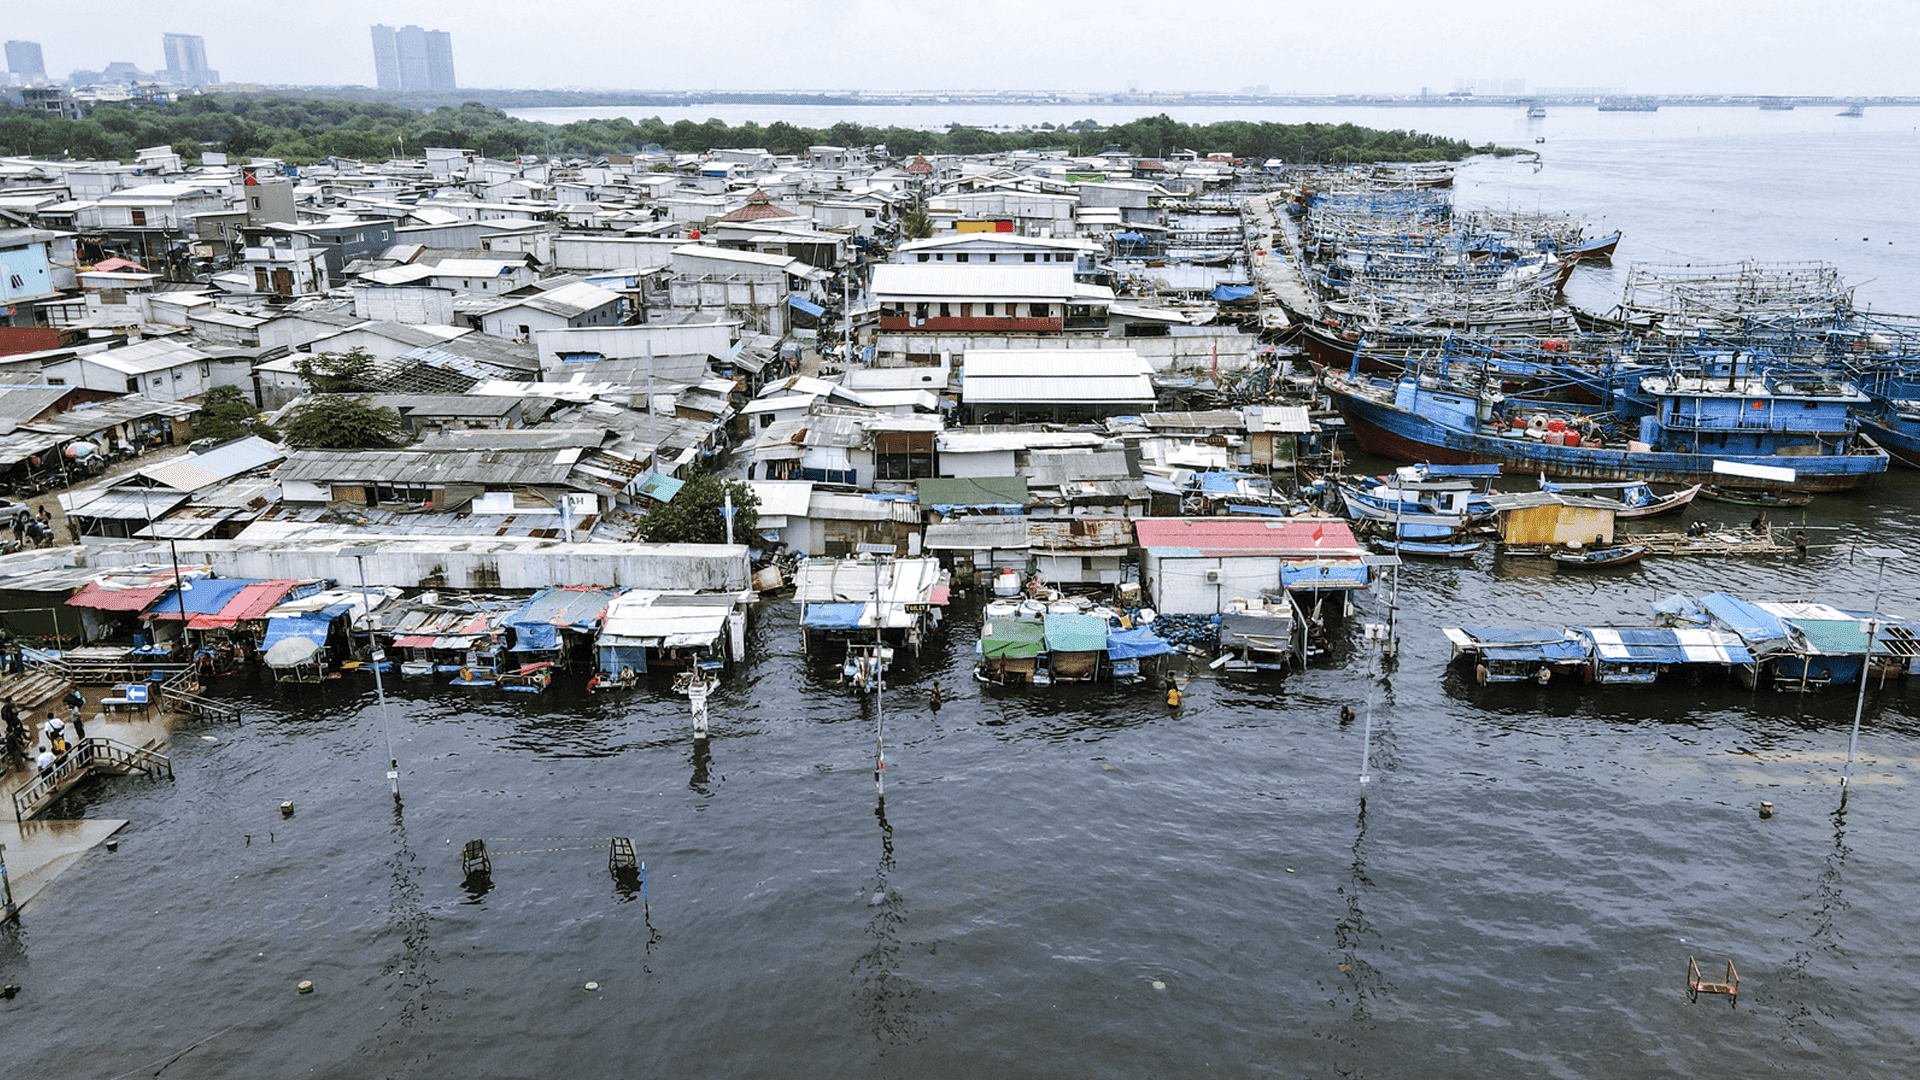
Erna lives in the Indonesian capital Jakarta - one of the fastest-sinking cities in the world. Her home is in one of the worst-affected areas, the north of the city, and is now much lower than the road.
The 37-year-old grew up here and re playing in nearby streets and praying in the mosque - that is now long gone, permanently underwater, as is the old port.
The walls of her home, built in the 1970s, are cracked, and you can see where thick layers of concrete have been added to the floor to try to restore it to ground level - about 10 times since it was built, and a metre thick in some places. The house is still subsiding, and Erna can’t afford to move.
This is one of dozens of coastal regions that are sinking at a worrying speed, according to a study by Nanyang Technological University (NTU) in Singapore.
The team studied subsidence in and around 48 coastal cities in Asia, Africa, Europe and the Americas. These are places that are particularly vulnerable to a combination of rising sea levels, which are mainly driven by climate change, and sinking land.
Based on the study and population data from the United Nations, the BBC estimates that nearly 76 million people live in parts of these cities that subsided, on average, at least 1cm per year between 2014 and 2020.
The impact on their lives can be huge - for example in Tianjin in north-east China, 3,000 people were evacuated from high-rise apartment buildings in 2023, after subsidence left large cracks in nearby streets.
All 48 urban areas in the NTU study are shown in this globe. The most extreme cases of subsidence were seen in Tianjin, which has undergone rapid industrial and infrastructural development this century. The worst-hit parts of the city sank up to 18.7cm per year between 2014 and 2020.

Select a city below to see how much it is sinking by. A map will display the most subsiding areas in that city in green, with details of factors contributing to subsidence.
The subsidence rate is measured from a reference point in each city, which scientists assume is more stable than others - you can read more on the methodology at the end of this article.


The perils of groundwater pumping
Many factors can contribute to subsidence, including building, mining, tectonic shifts, earthquakes, and natural soil consolidation - where soil is pressed closer and becomes more dense over time.
But “one of the most common causes is groundwater extraction”, explains the lead researcher on the NTU study, Cheryl Tay. It has had a major impact in half of the 48 coastal cities identified in the study.
Groundwater is found beneath the Earth’s surface in cracks and spaces in sand, soil and rock.
It makes up about half of the water used for domestic purposes - including drinking - around the world. It’s also essential for irrigating crops.
But as cities grow, freshwater supplies come under strain. Households and industries in some places drill their own wells or boreholes and extract too much - as in Jakarta.
Extracting excessive amounts of water in this way over extended periods of time compresses the soil, eventually causing the surface - and everything built on it - to sink or subside.

“A lot of the sinking cities are in Asia or South-East Asia,” says Ms Tay. “That is likely because the demand for water is much higher there with very fast-growing populations and a lot of development.
“That could lead to higher rates of groundwater extraction and then this could snowball… This means that flooding will be more frequent, intense, and prolonged in the future,” she adds, explaining there could also be “salt water intrusion that can affect agricultural land and the quality of drinking water”.
Some types of ground are affected more than others and Ms Tay believes the risks are especially acute for the many coastal cities built on low-lying deltas - where rivers divide before flowing into the sea. This includes places such as Jakarta, Bangkok, Ho Chi Minh City, and Shanghai.
Almost half of Jakarta now sits below sea level. Its location on swampy land where 13 rivers flow into the ocean makes it particularly vulnerable.
The combination of land sinking and sea levels rising accelerates the “relative sea level rise”, says Ms Tay. “There are two components: the land moving down and the water moving up.”


Indonesia’s meteorological agency has said that “the flood cycle, which used to occur every five years, could become more frequent” in Jakarta as “the overall trend of extreme rainfall is increasing in Indonesia, in line with rising surface temperatures and greenhouse gas concentrations”.
Over the past decade, dozens have died in floods in the city and at least 280,000 people have had to leave their homes until the water receded.
With parts of Jakarta now 4m lower than they were in 1970, Indonesia decided to build a new capital city - Nusantara - on a different island, Borneo, more than 1,200km (750 miles) away.
It is further from the coast and will rely on a huge dam and reservoir to store river and rainwater. The plan is to purify and distribute water to all homes and offices in the new capital, eliminating the need to extract groundwater.
However, the new city is controversial and development has slowed. There has been criticism of the $34bn price tag and its environmental impact on one of the most biodiverse places on the planet.


Five of the cities studied by NTU are in Africa, including Lagos in Nigeria. Last year, flooding affected more than 275,000 people there.
Twenty-eight-year-old Rukkayat moved to Ebute Metta, in the east of the city, three years ago in search of work and a better life.
But she could only afford to rent a house in a sinking area - one of the locations identified in the NTU report.
“It’s hard to live in a place where it gets easily flooded if downpours or storms hit the city,” she says. “I have to scoop water out of the corridor.”
The walls of the house are cracked, the floor is damp and the roof leaks - a common situation in sinking areas, experts say.
Both Lagos and Jakarta are facing rapid urbanisation and growing populations with more than half unable to access piped water, turning instead to pumping groundwater themselves.
The bowl effect
As many coastal cities deal with the combination of subsiding land and rising seas, they are looking for solutions - but these can sometimes contribute to other problems.
Some, including Jakarta, Alexandria in Egypt and Ho Chi Minh City in Vietnam have built dykes, walls and sand barriers along their coastlines to try to prevent flooding from the sea.


But as walls get higher and bigger, a “bowl effect” can be created, says Prof Pietro Teatini of the University of Padova in Italy, potentially trapping rain and river water in areas and preventing it from flowing back into the sea. This can contribute to flooding.
So, to drain excess water, Jakarta and Ho Chi Minh City are among those that have built pumping stations.
However, this does not address the causes of subsidence or flooding.
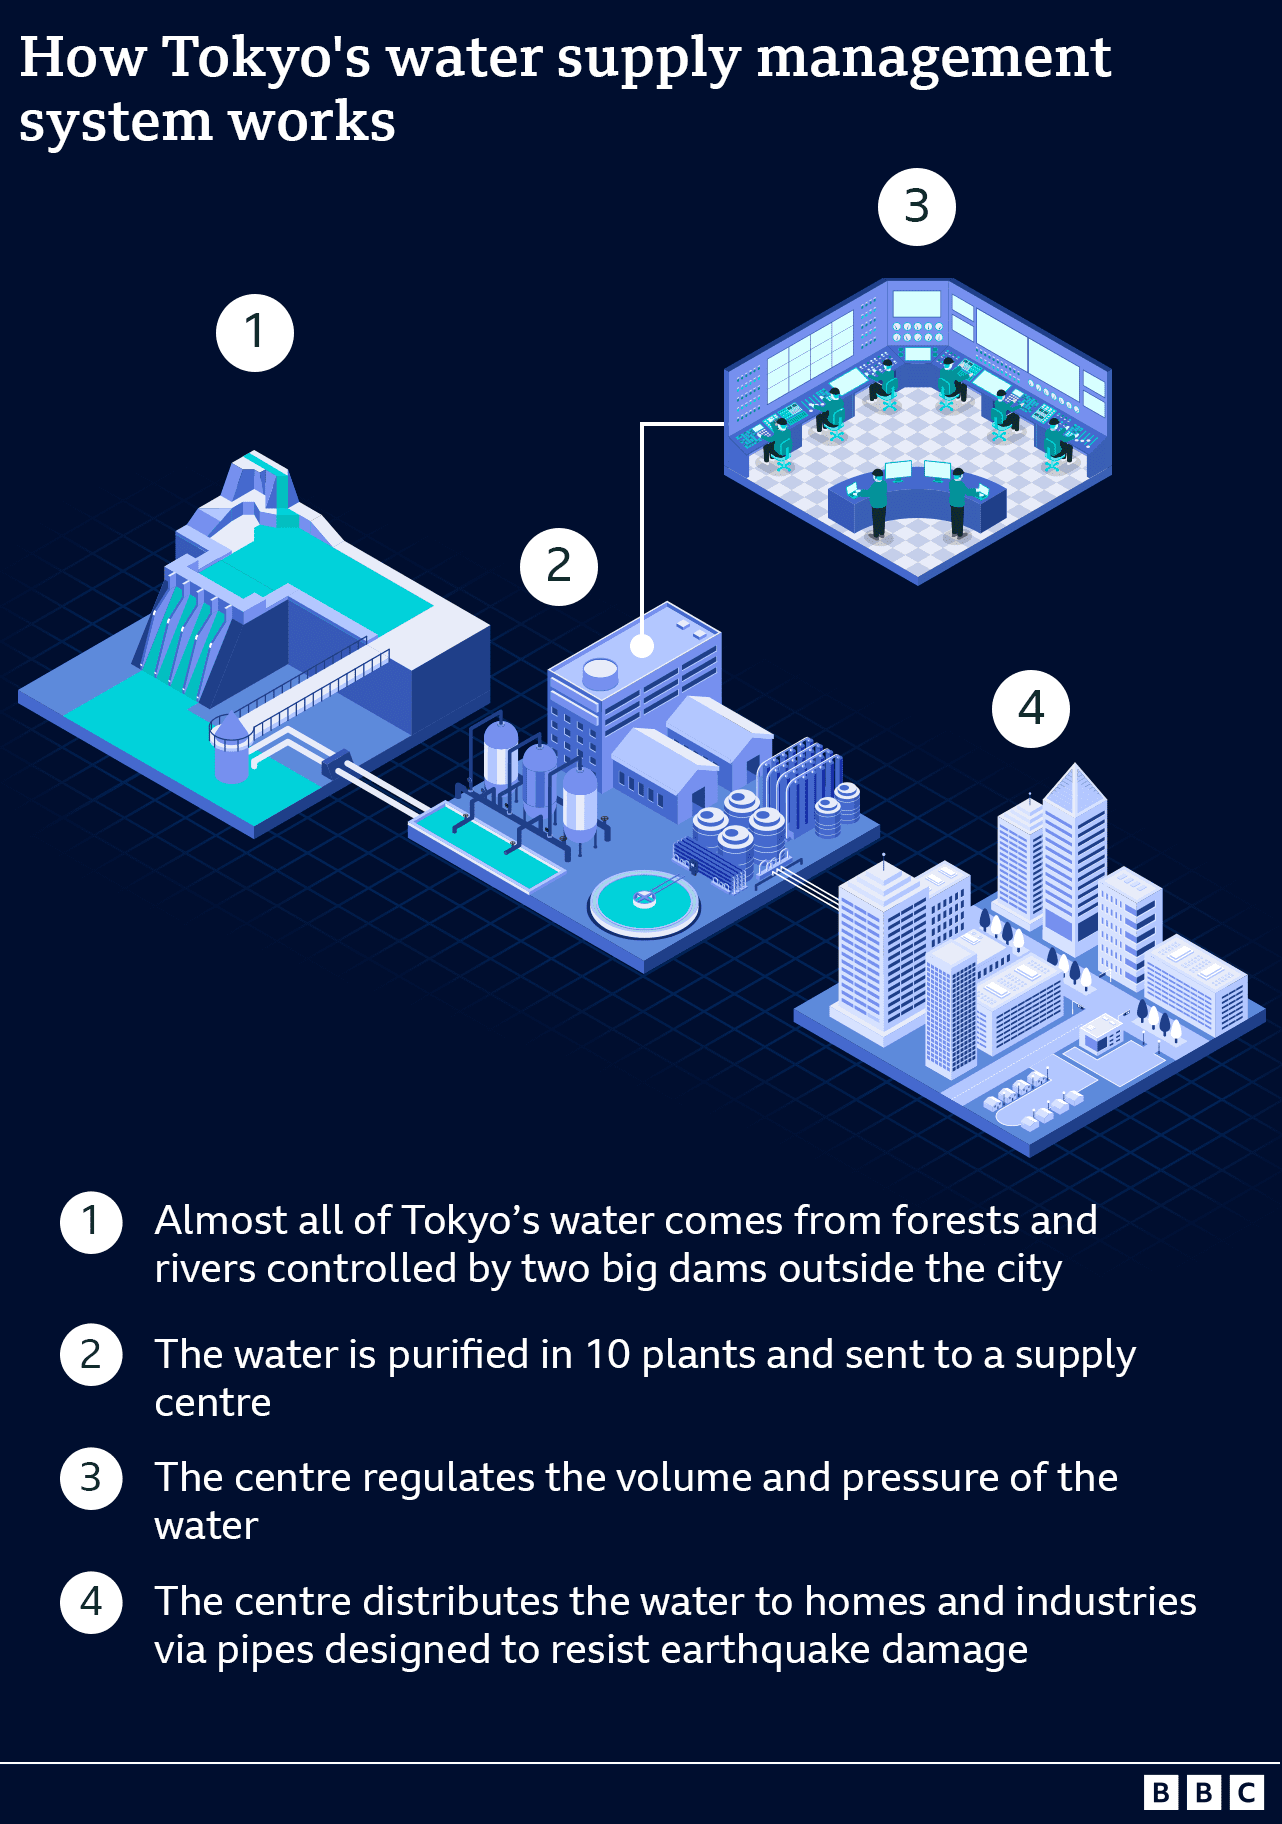
How Tokyo solved the problem
When Tokyo found parts of its city were subsiding, it took a different approach and decided to tackle the root of the problem.
The sinking slowed significantly in the 1970s after Tokyo imposed strict regulations on groundwater pumping.
It also built a water supply management system, which scientists argue is the most efficient way to stop subsidence.
The NTU study found that today the city is much more stable, although a few small areas have sunk by between 0.01 and 2.4cm per year between 2014 and 2020.
So, how does Tokyo’s system work?
Despite the effectiveness of Tokyo’s system, scientists are sceptical it can be applied widely given the high build and maintenance costs, says Prof Miguel Esteban of Waseda University in Japan.
Nonetheless, he adds, some Asian cities still look at Tokyo’s approach as a model.
Taipei, for example, reduced groundwater extraction in the 1970s which, in turn, helped to slow down its subsidence rates.

Many other cities - including Houston, Bangkok and London - also carefully regulate groundwater pumping to ensure it is neither too low nor too high.
Some cities have tried different methods. Shanghai, for instance, has applied “water injection, which works very well”, says Prof Teatini.
It injected purified water from the Yangtze River into the ground through wells that had previously been used to extract groundwater.
Others, such as Chongqing in China and San Salvador in El Salvador, have adopted the principles of sponge cities.
Instead of simply using non-porous concrete and asphalt in areas such as pavements, a sponge city makes use of surfaces that are designed to absorb water naturally, such as soil, grass and trees. The construction of parks, wetlands and green spaces is prioritised, along with lakes and ponds where water can be diverted and stored during the rainy season.


This may offer a “more viable and sustainable solution, it costs only a tenth of building dams”, says Prof Manoochehr Shirzaei of Virginia Tech University.
But critics say that it is hard to add these features to existing developments and often they are not installed on a large enough scale to make a big difference.
And behind any investment, there needs to be long-term political commitment, says Prof Shirzaei.
“Land subsidence emerges gradually over time, so to deal with that, we have to take difficult decisions which remain in place for decades,” he says, even if pumping restrictions are initially unpopular with voters who rely on wells and boreholes for water.
Without change, experts warn there will be more people like Erna, fighting a losing battle as their homes gradually slip away.
A note on methodology
For its study the NTU chose coastal urban agglomerations within 50km (30 miles) of the coast, with a population of at least five million in 2020. It analysed satellite images, comparing data from 2014 to 2020 to estimate subsidence rates.
The subsidence rate is measured from a reference point in each city, which scientists assume is more stable than others. However, if the reference point is also sinking or rising, other parts of the city might be sinking faster or slower than the measurements suggest.
This could affect the BBC estimates of how many people are affected.
The subsidence rates used here should therefore be seen as a relative measure, helping to identify which areas are likely more affected than others.
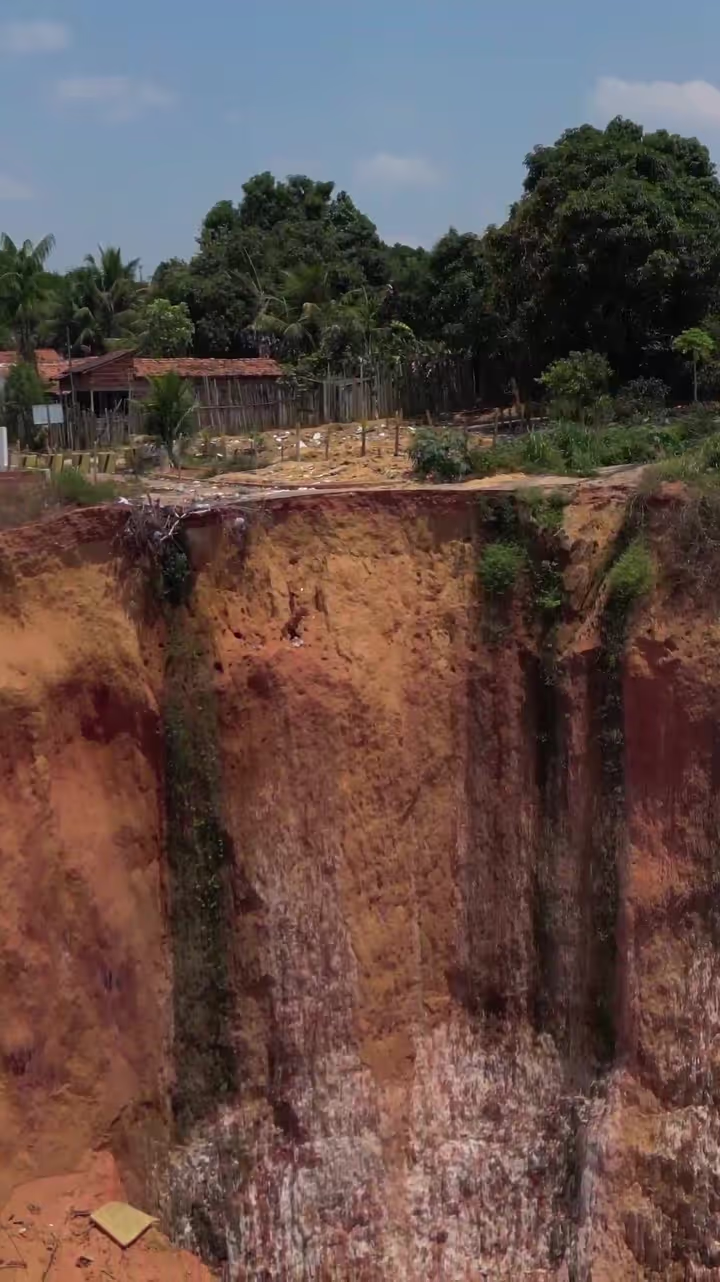 The vast ravines swallowing whole neighbourhoods around the world
 How much warmer is your city?
 Climate change: Where we are in seven charts and what you can do to help